Tour Cyclops
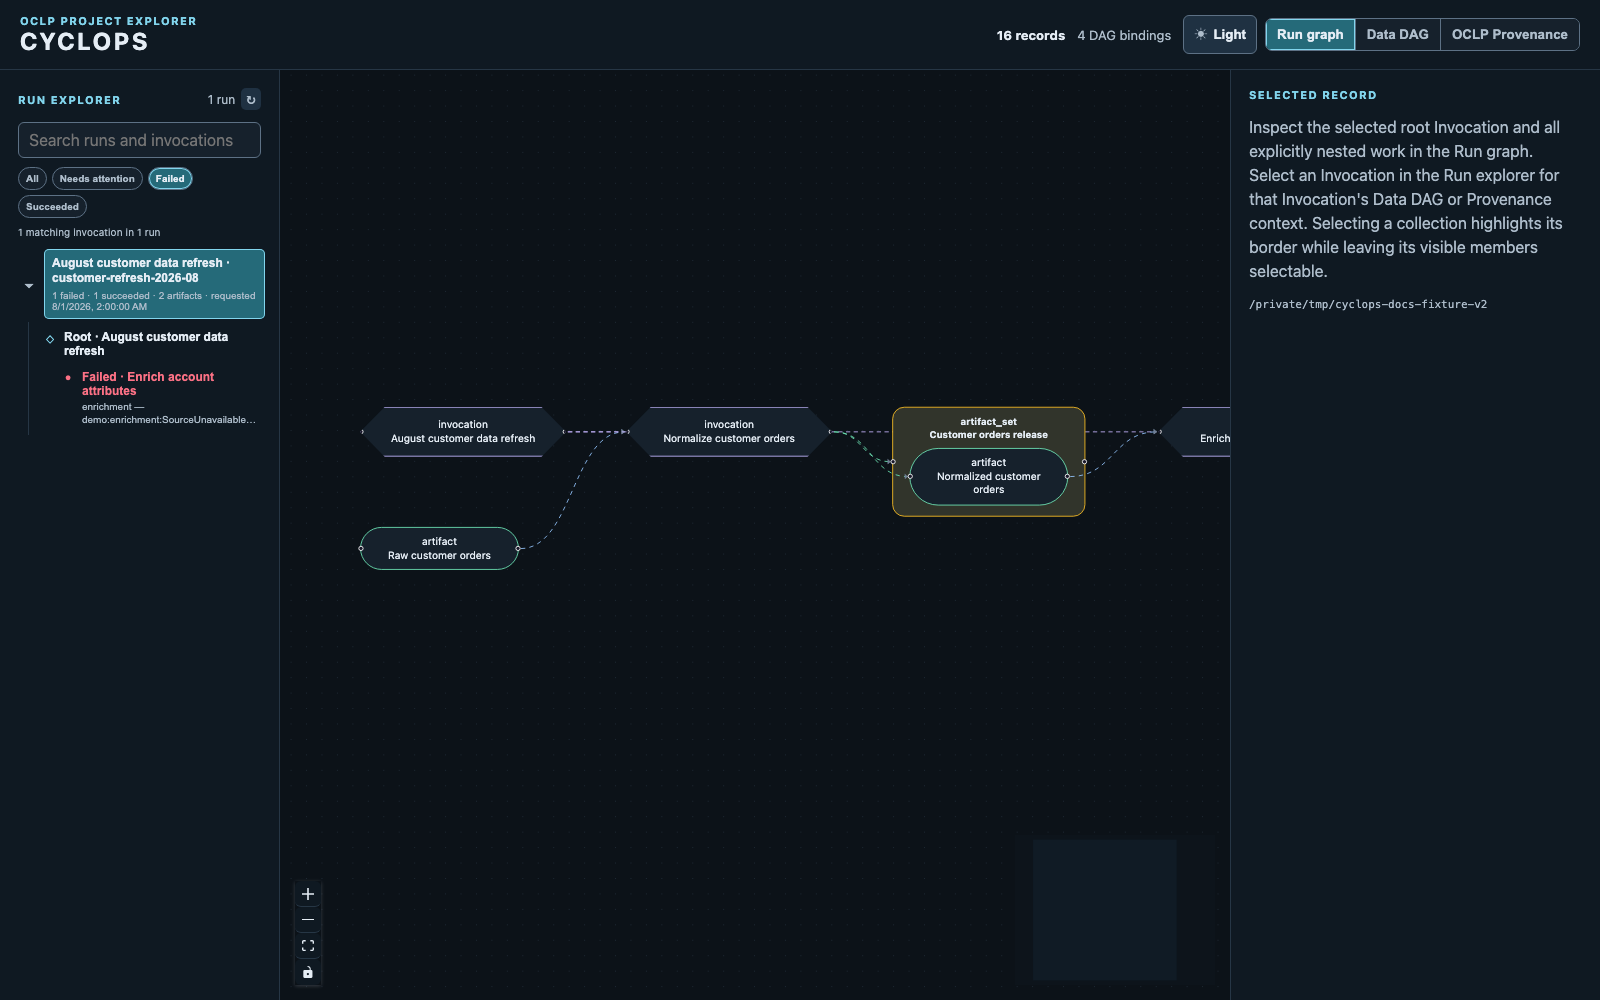
Cyclops reads an existing local OCLP store and projects its immutable records into a navigable run lineage. The images below use a small generic customer-data refresh: one nested task succeeds, one fails, and the successful task publishes a named release.
Start from the run
The Lineage explorer is the starting point. It groups real Executions that
claim the same lifecycle-profile run_id; legacy stores fall back to an
explicit parent-Execution hierarchy. Separate lifecycle runs join one lineage
only through an explicit data handoff: a produced-and-consumed Artifact or
ArtifactSet, or a directly published lifecycle-owned ArtifactSet consumed by
another run. The default Run lineage shows the selected connected lifecycle and all its
work. Solid animated edges carry data; no controller Execution is invented for
run navigation. It does not link unrelated runs simply because they share an
unproduced input.
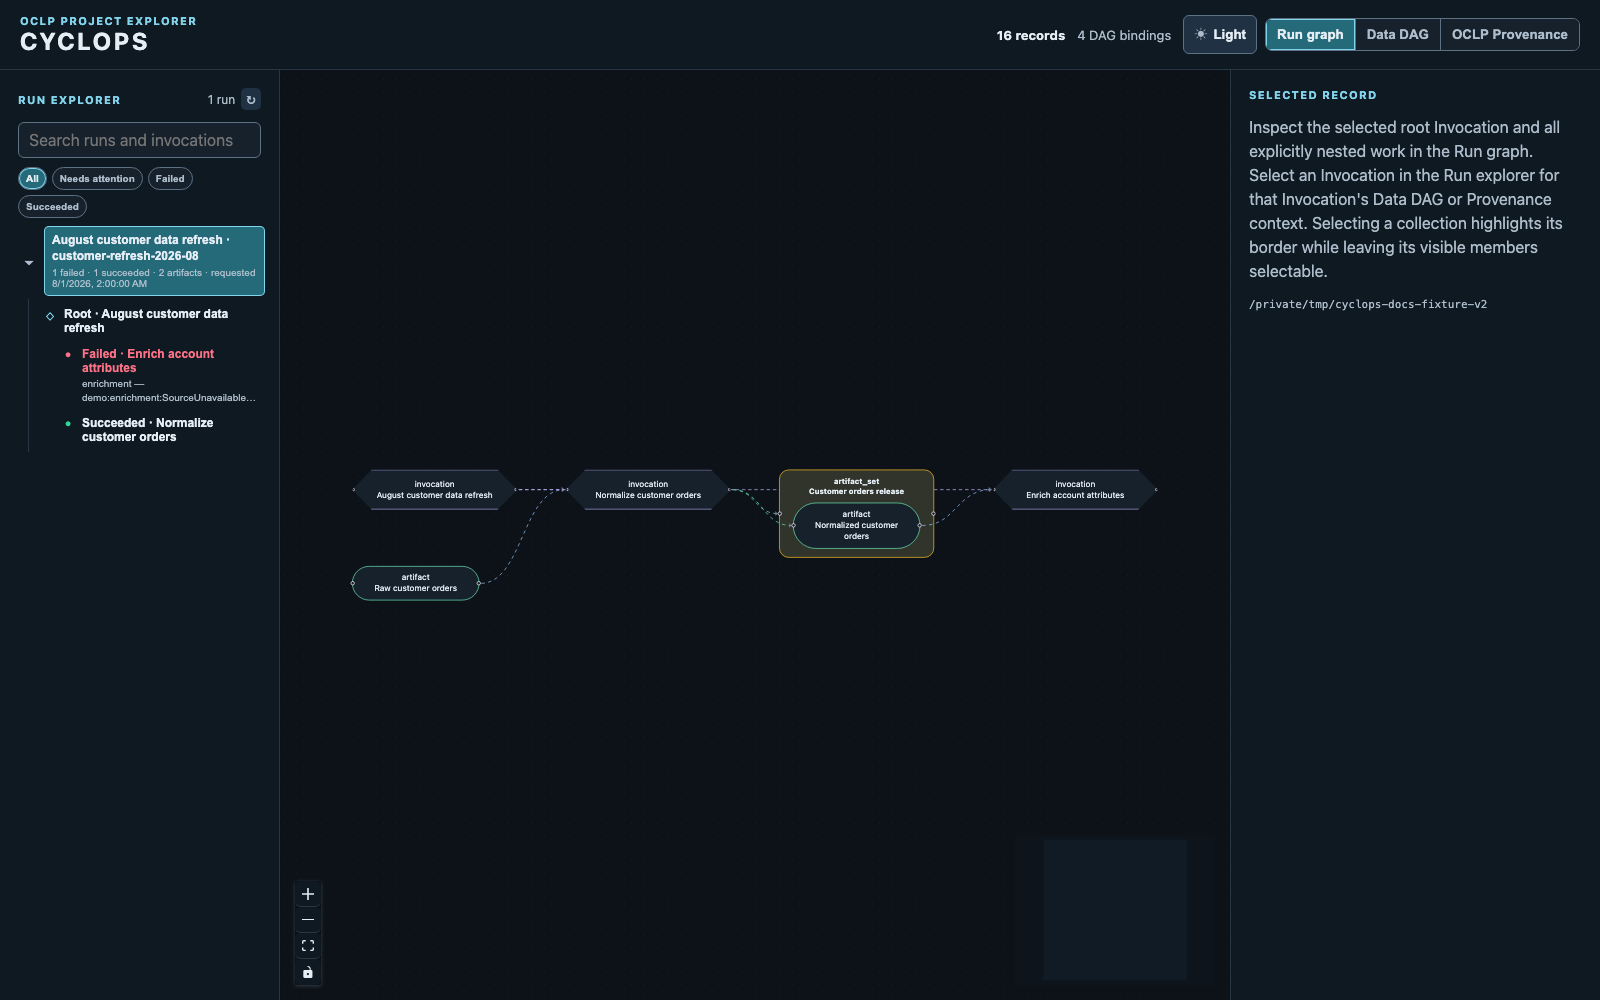
An ArtifactSet starts as one collapsed collection node. Its layered backplates, member count, and expand chevron make the hidden members visible as a concept without showing them individually. Double-click it to reveal its unshared member Artifacts inside a containing box, and double-click again to collapse them. It organizes a published collection without replacing the underlying Artifact records or adding a new execution step.
Use Export GIF in the toolbar to download a short loop of the complete current graph scope. Cyclops fits that scope for capture, then restores your working viewport. It is useful for explaining a run in a document or issue without making the read-only explorer mutate the OCLP store.
You can drag nodes into a more useful arrangement. The placement lasts only in the current browser session and graph scope. Auto-arrange restores a collision-aware layered layout for the visible non-Timeline graph. In Timeline, nodes move vertically only: their horizontal position remains pinned to their immutable timestamp.
Inspect the durable record
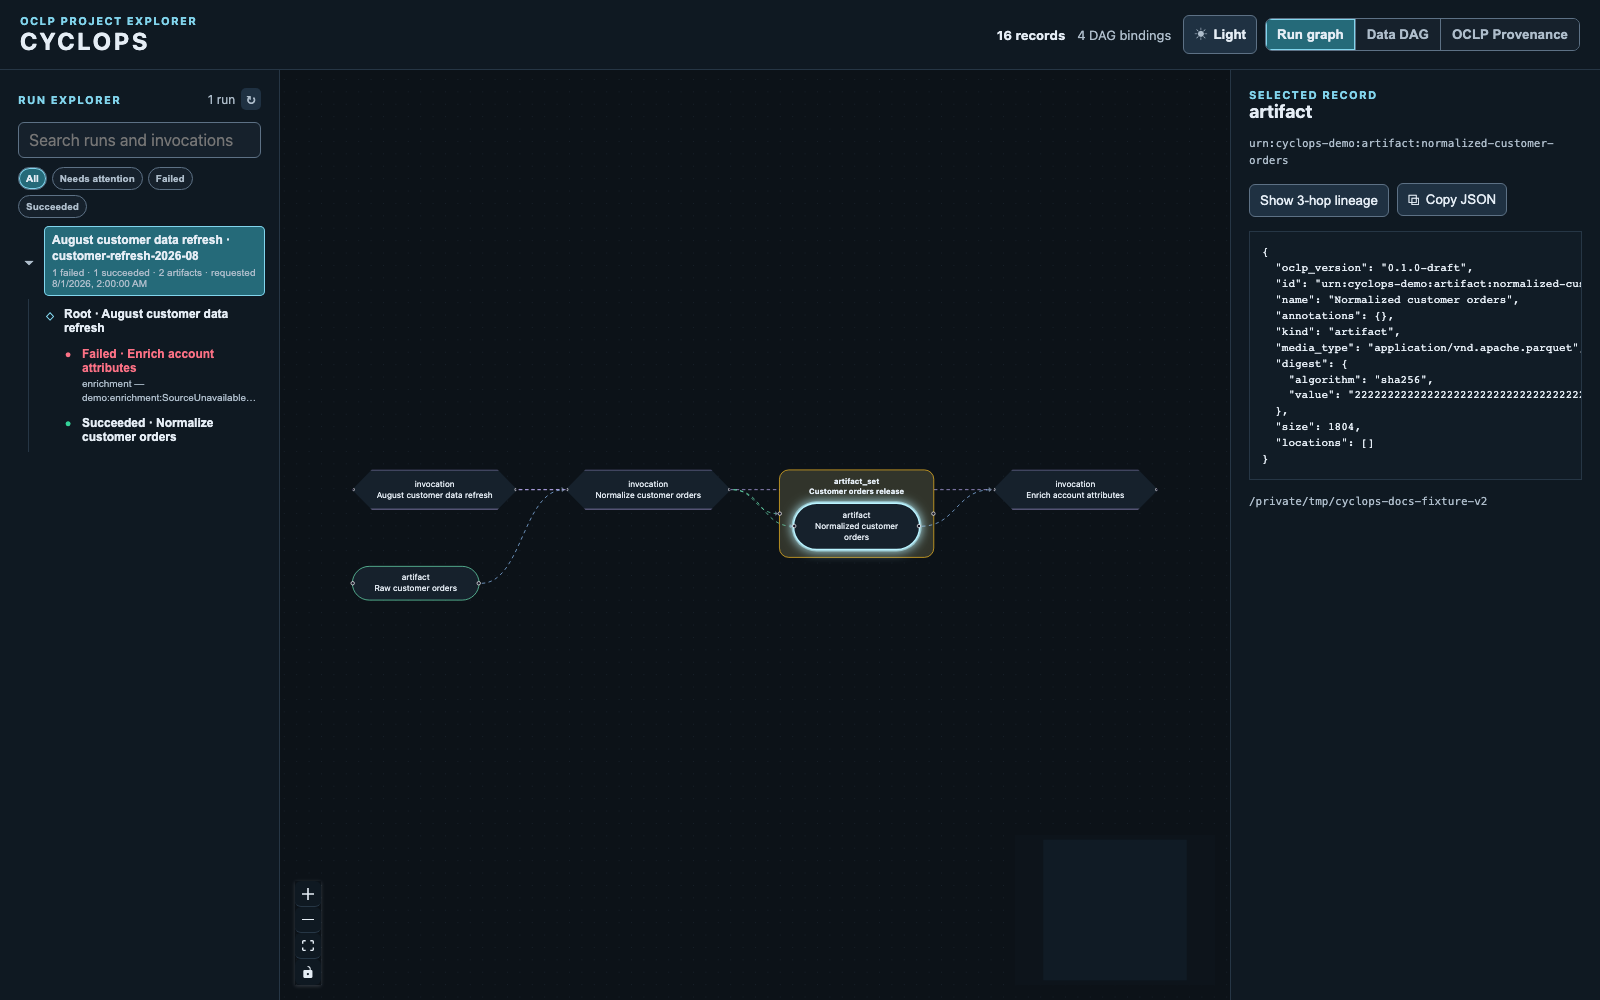
Select any node to inspect the immutable OCLP JSON that Cyclops read from the local store. The detail panel keeps the record's kind and ID visible, exposes a focused lineage view, and provides a Copy JSON action for troubleshooting, tests, or downstream tooling.
Add provenance when needed
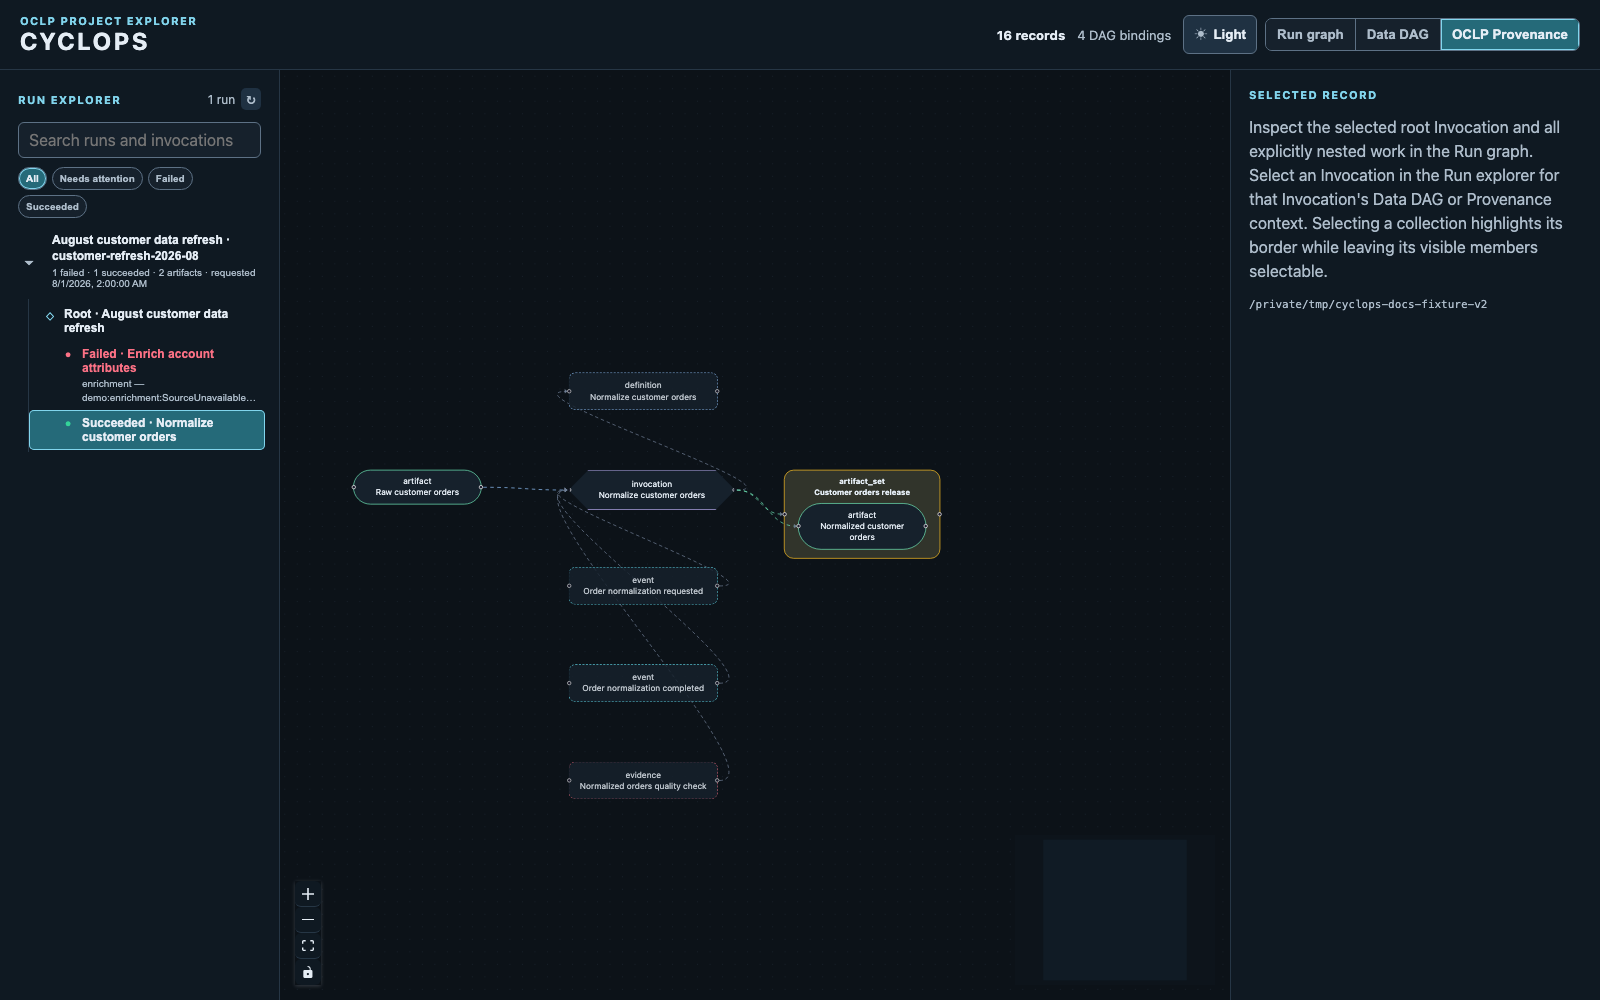
Select a task, then choose Show provenance context in its record inspector. The focused Data DAG stays in place while Cyclops adds the Computation, required Events, Evidence, and other non-dataflow context recorded for that Execution. Events and Evidence form a chronological timeline using their Core timestamps (and Event sequence when timestamps tie), while the Computation stays as contextual metadata.
Here is the same idea in an exported dogfood provenance graph. The bright, flowing edges are direct Data DAG bindings; the quiet dashed edges add Computation, Event, and Evidence context without claiming those records are inputs or outputs of the computation.
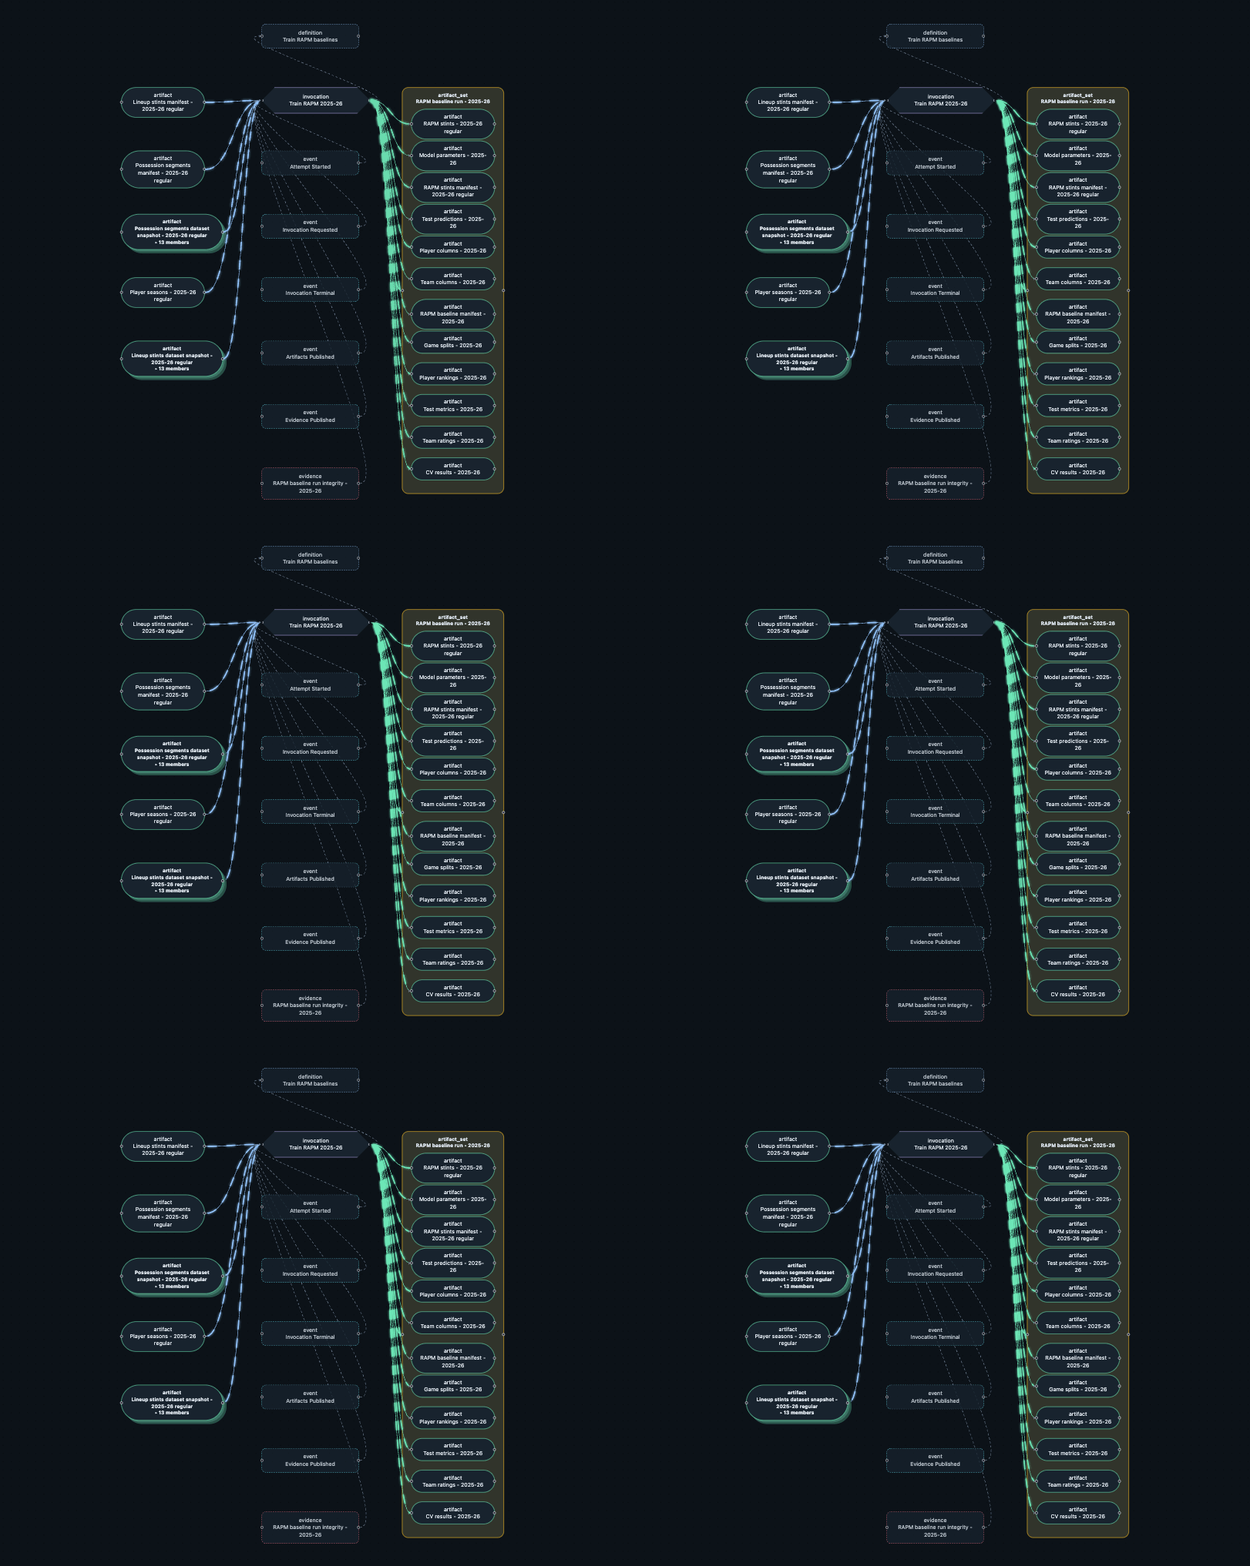
Provenance context follows the explorer selection: choosing a lifecycle run shows the Events and Evidence for all of its Executions, while choosing one Execution narrows the overlay to that computation.
Follow a run through time
Choose Data DAG for only the strict Artifact → Execution → Artifact
flow of the selected Execution. Choose Timeline to arrange that same
selection on an absolute UTC time axis. Select the lifecycle run to view all of its
work, or a child Execution to inspect just that computation. Each visible
Execution has a lane, while its Events and Evidence are ordered left-to-right
using their Core timestamps and Event sequence. Adaptive grid lines scale from
seconds to days as the time span grows. Direct inputs and outputs remain
visible: an Artifact with immutable created_at appears at that asserted time,
while an input without it appears in an Untimed inputs column before the
axis. Their original Data DAG edges remain visible without inventing a date.
Event timestamps still describe publication and other execution chronology.
Find work that needs attention
Use the search box or status filters in the Lineage explorer to narrow its navigation tree. A failed Execution is shown in red, with the portable OCLP Diagnostic from its terminal Event beneath its label. The graph itself remains the selected run; filtering never changes OCLP records or silently discards their context.
See Using Cyclops for the local startup command, graph semantics, refresh behavior, and API details.