Bayesian model review / 2025-26
What Bayesian RAPM Adds to the Same Ridge Ranking
The conjugate Bayesian model deliberately reproduces the selected ridge RAPM point estimates, then replaces a single leaderboard with joint uncertainty over player effects, ranks, and held-out stint predictions.
Conditional model uncertainty
These credible intervals condition on the signed linear model, selected lambda, possession weights, and equal-segment allocation. They do not cover uncertainty about lambda selection, possession construction, omitted context, or whether the Gaussian likelihood is the right data-generating model.
Same center, new distribution
The model uses the same signed player matrix and normalized possession weights as ridge:
The player prior is
with a flat home-court intercept and \(p(\sigma^2) \propto 1/\sigma^2\). Because this is conjugate Gaussian regression, the posterior is exact: there is no MCMC convergence or variational-approximation error.
The posterior location and ridge solution are the same linear solve. The small differences below are numerical solver tolerance, not modeling disagreement.
| Check | Result |
|---|---|
| Maximum player-coefficient difference | 2.21e-06 |
| Coefficient correlation | 1.000000000 |
| Eligible-rank correlation | 1.000000000 |
| Initial top-25 overlap | 25/25 |
| Maximum held-out point-prediction difference | 6.50e-06 |
| Ridge game-margin RMSE | 15.811 |
| Bayesian-mean game-margin RMSE | 15.811 |
This is therefore not a fourth competing leaderboard. It is the probabilistic interpretation of the chosen ridge model.
The initial top 25
Only 9 of 25 initial leaders have a 90% marginal credible interval entirely above zero. Only 4 have at least a 50% posterior probability of remaining top 25, compared with 15 under the complete-game bootstrap.
| Rank | Player | RAPM | Bayesian 90% interval | P(positive) | Bayes top 25 | Bootstrap top 25 | Posterior rank 90% |
|---|---|---|---|---|---|---|---|
| 1 | Victor Wembanyama | 6.34 | [2.32, 10.36] | 99.5% | 69.9% | 100% | 1-106 |
| 2 | Shai Gilgeous-Alexander | 6.13 | [2.25, 10.00] | 99.5% | 66.7% | 98% | 1-111 |
| 3 | Kawhi Leonard | 5.50 | [1.59, 9.41] | 99.0% | 57.5% | 91% | 1-144 |
| 4 | Chet Holmgren | 5.43 | [1.49, 9.38] | 98.8% | 56.9% | 93% | 1-140 |
| 5 | Nikola Jokić | 5.02 | [0.98, 9.06] | 98.0% | 49.3% | 91.5% | 2-167 |
| 6 | Derrick White | 4.85 | [0.95, 8.75] | 98.0% | 46.4% | 82% | 2-178 |
| 7 | Neemias Queta | 4.31 | [0.24, 8.37] | 95.9% | 39.0% | 71% | 2-213 |
| 8 | Dyson Daniels | 4.08 | [0.17, 7.99] | 95.7% | 33.5% | 62% | 3-230 |
| 9 | Donovan Mitchell | 4.00 | [0.17, 7.82] | 95.7% | 32.5% | 54% | 4-215 |
| 10 | Alex Caruso | 3.96 | [-0.23, 8.14] | 94.0% | 33.2% | 60% | 3-243 |
| 11 | Cade Cunningham | 3.93 | [-0.04, 7.90] | 94.8% | 31.8% | 62.5% | 3-222 |
| 12 | Marcus Smart | 3.89 | [-0.08, 7.87] | 94.6% | 30.3% | 54% | 4-232 |
| 13 | Jimmy Butler III | 3.84 | [-0.33, 8.01] | 93.5% | 32.6% | 55.5% | 3-240 |
| 14 | Bam Adebayo | 3.81 | [-0.07, 7.69] | 94.7% | 29.8% | 60.5% | 4-231 |
| 15 | Moussa Diabaté | 3.76 | [-0.29, 7.80] | 93.7% | 29.4% | 49% | 3-253 |
| 16 | Julian Champagnie | 3.71 | [-0.15, 7.57] | 94.3% | 27.7% | 58.0% | 4-244 |
| 17 | Devin Vassell | 3.51 | [-0.38, 7.39] | 93.1% | 25.0% | 48.5% | 5-258 |
| 18 | Devin Booker | 3.42 | [-0.49, 7.33] | 92.5% | 24.2% | 38% | 5-258 |
| 19 | Amen Thompson | 3.38 | [-0.55, 7.32] | 92.1% | 23.5% | 44% | 5-264 |
| 20 | Ajay Mitchell | 3.38 | [-0.60, 7.36] | 91.9% | 23.8% | 42.5% | 5-271 |
| 21 | OG Anunoby | 3.30 | [-0.62, 7.22] | 91.7% | 22.2% | 39.5% | 6-269 |
| 22 | Ausar Thompson | 3.11 | [-0.93, 7.16] | 89.7% | 22.4% | 32.5% | 6-285 |
| 23 | Donte DiVincenzo | 3.11 | [-0.84, 7.06] | 90.2% | 21.2% | 34.5% | 6-283 |
| 24 | Jalen Smith | 3.10 | [-1.04, 7.24] | 89.1% | 22.8% | 34.5% | 6-296 |
| 25 | Brandon Miller | 3.08 | [-0.86, 7.03] | 90.1% | 20.1% | 28.0% | 7-275 |
The rank columns come from joint draws, so they retain posterior covariance between teammates and opponents. Marginal coefficient intervals alone cannot answer a rank question.
Two uncertainty questions
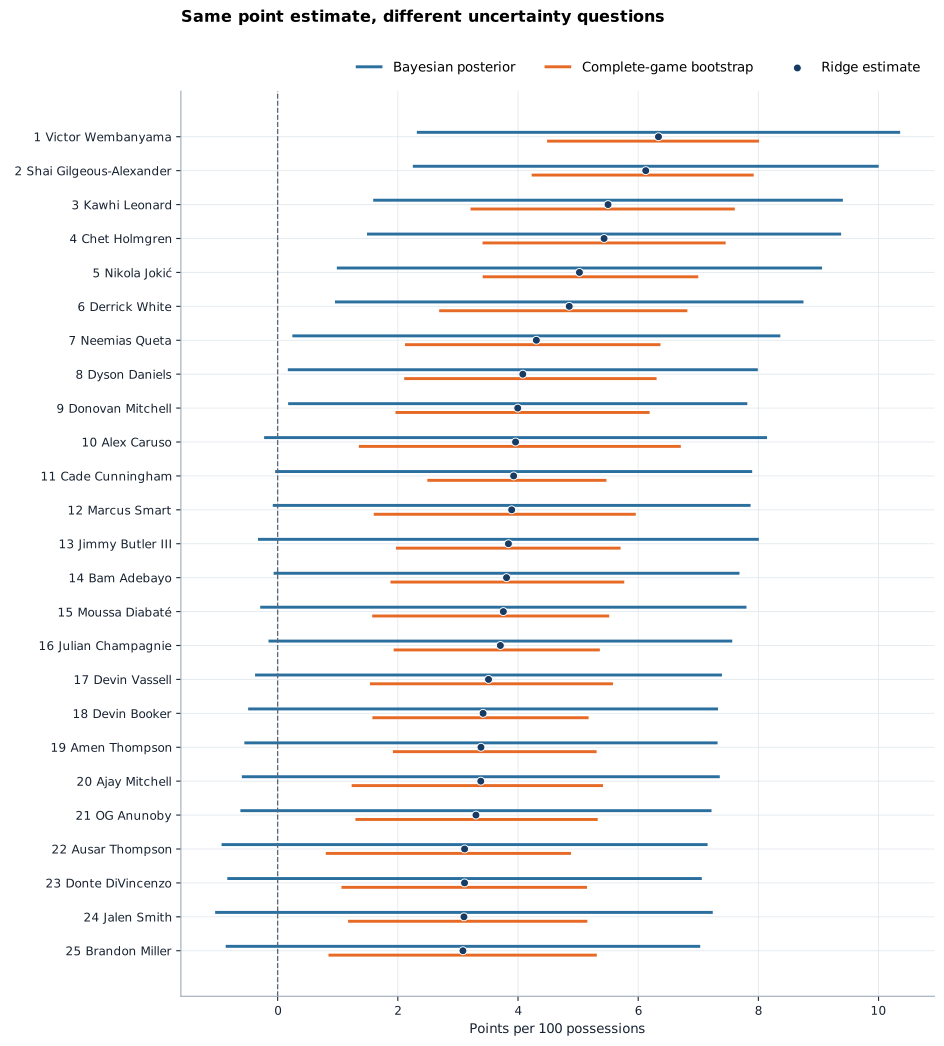
Across all 452 eligible players, the Bayesian interval is 2.16 times as wide as the complete-game bootstrap interval at the median. This does not make one interval correct and the other wrong:
- The bootstrap resamples complete games and refits ridge. It measures the sampling stability of the regularized estimation procedure.
- The Bayesian posterior conditions on this season's design and asks which latent coefficient vectors remain plausible under the likelihood and prior.
- Ridge can be stable under resampling while several correlated player effects remain weakly identified. Shrinkage reduces estimator variance without making the underlying parameters equally precise.
This distinction is visible in rank probabilities:
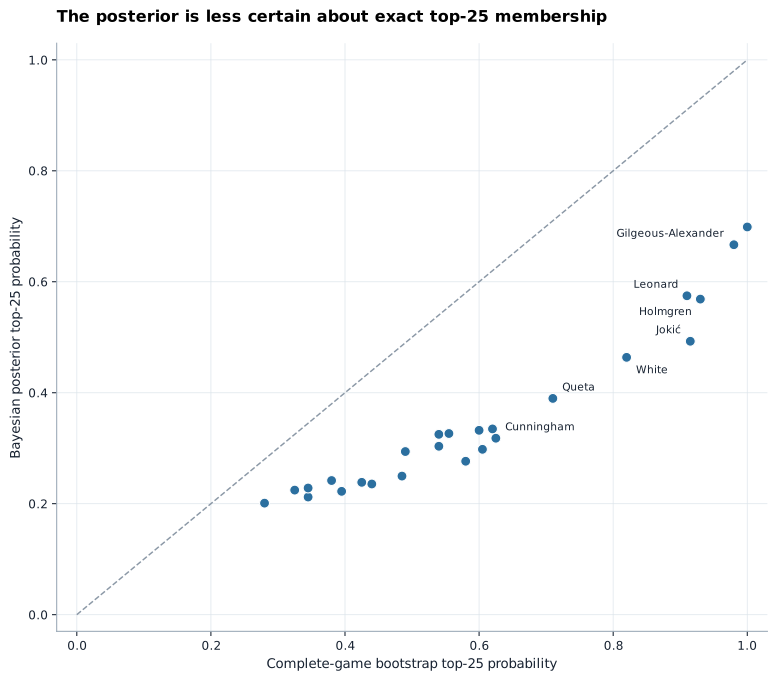
Victor Wembanyama and Shai Gilgeous-Alexander have the strongest posterior top-25 support at 69.9% and 66.7%. The largest top-25 probability difference is Nikola Jokić: 49.3% posterior versus 91.5% bootstrap. The disagreement concerns rank precision, not the shared point estimate.
Held-out predictive calibration
The posterior was separately fit on the original 1,044-game final training window. Coverage below is measured on the untouched final 186 games and 5,789 stints.
| Nominal interval | Stint coverage | Possession-weighted coverage | Weighted mean width |
|---|---|---|---|
| 50% | 50.4% | 51.8% | 130.2 |
| 80% | 80.0% | 81.8% | 247.3 |
| 90% | 90.6% | 91.7% | 317.4 |
| 95% | 95.0% | 96.2% | 378.2 |
The 90% predictive interval covers 90.6% of held-out stints and 91.7% after possession weighting. That is close to nominal, with modest conservatism under the weighted view. These are intervals for noisy stint net rating, not game margin or a player coefficient.
What this baseline establishes
The Bayesian model adds three things the ridge leaderboard cannot provide:
- uncertainty about coefficient sign and magnitude;
- joint rank and top-N probabilities;
- posterior predictive intervals with measurable held-out coverage.
It also clarifies the next modeling requirement. A hierarchical Bayesian RAPM should estimate prior scales rather than inheriting one cross-validated lambda, and it can partially pool by season, age, position, or draft information. That is where PyMC becomes useful. The exact conjugate model remains the reference implementation because any richer model should justify its additional complexity against these closed-form results.
Reproduce this page
uv run nba-train-bayesian-rapm 2025-26 \
  --source-run-id baseline-2025-26-20260727T230533Z-72eac627

uv run --group docs nba-build-bayesian-rapm-case-study 2025-26 \
  --bayesian-run-id bayesian-2025-26-20260729T043953Z-b50cc2f7 \
  --diagnostics-run-id diagnostics-2025-26-20260728T043406Z-32196bfa
| Provenance | Value |
|---|---|
| Bayesian run | bayesian-2025-26-20260729T043953Z-b50cc2f7 |
| Source ridge run | baseline-2025-26-20260727T230533Z-72eac627 |
| Diagnostics run | diagnostics-2025-26-20260728T043406Z-32196bfa |
| Bayesian manifest SHA-256 | f396761e8104d71e44a6f0332c5fd9b0574d0aaf1f4b212ce876b37764a42930 |
| Diagnostics manifest SHA-256 | f3d2eb563f69137284fb50d790a6a1ec12c70bccaa7ccb672584bc85ed16c91b |
| Generator source SHA-256 | ecda95cf4093830b1ce095710c51c784562f2becabe1c3c2badc5bdec343d617 |
| Selected lambda | 0.03 |
| Player population | 582 total / 452 eligible |
The ridge/Bayesian equivalence follows the standard Gaussian-prior interpretation summarized by van Wieringen (2015). Posterior and posterior-predictive interpretation follows Gelman et al., Bayesian Data Analysis. See the Bayesian RAPM methodology for the full artifact contract and the original RAPM case study for the broader stability diagnostics.