Forward Contextual RAPM
Forward Contextual RAPM is the current gold-standard preseason model in this project. It retains an interpretable, one-number additive value for every player while carrying a separate nonlinear estimate of lineup composition from one completed season into the next. On the frozen 2025-26 regular-season holdout, it has the best game-margin RMSE, team net-rating error, and Pythagorean win-total error in the Frozen Preseason Leaderboard.
It is intentionally not one 30-season pooled nonlinear model. The state is updated one completed season at a time. That keeps both the player prior and the lineup-composition function on the same forward-looking information boundary.
Model State
For each season \(t\), the model maintains three pieces of state:
- \(\mu_{i,t}\): player \(i\)'s preseason RAPM prior.
- \(\beta_{i,t}\): player \(i\)'s completed-season additive coefficient.
- \(g_t(z)\): a nonlinear home-minus-away lineup-composition correction, where \(z\) is built from the two five-player lineups' trait profiles.
The published player ranking is \(\beta_{i,t}\), carried forward as the additive part of \(\mu_{i,t+1}\). The model does not try to allocate \(g_t\) to individual players because its value depends on the five-player combination. For example, the same high-usage guard can receive a different contextual correction next to four shooters than next to another ball-dominant creator.
Training Data And Player Profiles
The additive fit uses regular-season reconstructed stints. A row is a fixed home/away lineup interval with target \(y_{s,t}\), the home team's net rating over the stint, and weight \(w_{s,t}\), the number of possessions in that stint. The signed RAPM design vector \(x_{s,t}\) has \(+1\) for each home player and \(-1\) for each away player.
Every player in a season also receives a leakage-safe trait profile. Returning players use their immediately preceding season's possession-native box-score rates. Each rate is stabilized toward the historical league rate with 300 pseudo-possessions:
The raw profile contains three-point attempts and makes, assists, turnovers, usage events, offensive and defensive rebounds, steals, and blocks per 100 possessions. A first-season player has no previous NBA rates, so the profile is a draft-cohort profile blended toward the historical low-exposure replacement profile. The blend weight is the same forward exposure-gate probability used by the cold-start RAPM prior. Thus cold-start profiles are explicit estimates, not silent zero fills.
How This Differs From A Typical Box-Score Prior
Most box-score RAPM priors predict a single prior value for each player:
That scalar becomes the prior mean for player \(i\)'s RAPM coefficient. The box score is therefore answering a player-level question: how valuable should this player be expected to be in an average lineup context?
Forward Contextual RAPM does not turn these rates into another permanent player rating. It preserves the forward RAPM and cold-start state as the additive player prior, then uses the rate profiles only to construct a lineup-level term:
The correction belongs to the combination of five players, not to a single player. It can therefore represent diminishing returns and complements. A second high-usage player may have a different correction beside four shooters than beside another ball-dominant creator; an extra shooter may matter more in a lineup whose bottom two shooters are weak; and rebounding can saturate rather than rising linearly with each player's individual rebound rate.
This makes the box-score layer a structured lineup-synergy model rather than a conventional box-score prior. The distinction also preserves interpretability: the published player ranking remains the additive RAPM state, while \(g_t\) is reported and applied only when evaluating a concrete lineup.
Lineup Context Function
For a home lineup \(H\) and away lineup \(A\), \(z=\phi(H,A)\) contains home-minus-away differences in the nine player-rate totals above plus eleven composition summaries:
- Bottom-two three-point makes and the number of credible shooters.
- Top-two assists and concentration of usage in the top two players.
- Square-root transformed offensive and defensive rebounding totals.
- Counts and weights of imputed/replacement profiles.
- Shooting-by-usage, shooter-by-passing, and rebounding-by-usage interactions.
This construction deliberately captures diminishing and complementary lineup properties without pretending that a player has a fixed interaction value. For example, bottom-two shooting can distinguish a five-player unit with no credible floor spacing from one whose total shooting is carried by only one elite shooter.
The current contextual function is a possession-weighted spline Ridge model:
h applies a quadratic spline basis with four knots to each feature, then
standardizes the expanded columns and fits Ridge regression. The large fixed
alpha is a conservative first-pass regularizer. It shrinks nonlinear effects
heavily while still allowing smooth saturation and interaction patterns. Alpha
tuning is deliberately deferred until this state-transition design has been
validated on additional frozen seasons.
Seasonal Transition
For season \(t\), the completed prior-season function \(g_{t-1}\) is scored on season-\(t\) preseason profiles and subtracted from each raw stint target:
The player coefficients are then fit with prior-centered, possession-weighted Ridge:
\(\lambda_t\) is held to the already-published season-specific value selected by the forward exposure-gated RAPM run. Holding that schedule fixed isolates the impact of the new contextual state transition instead of retuning two sources of regularization simultaneously.
After season \(t\) completes, the model computes raw residuals \(y_{s,t}-\hat a_t-x_{s,t}^{\mathsf T}\hat\beta_t\) and fits \(g_t\) to those residuals. The resulting \(\hat\beta_t\) and \(g_t\) become the state used for season \(t+1\). Returning players receive their completed \(\hat\beta_t\) as the next prior; first-season players use the forward exposure-gated cold-start prior. The first two historical seasons bootstrap the system before a completed context function exists.
This sequencing is the essential distinction: history influences the present only through repeated state updates, not because the model trains a pooled cross-era context function and applies it retrospectively.
Frozen Forecast Boundary
The 2025-26 holdout is scored using only:
- Completed 2024-25 player coefficients and cold-start state.
- The completed \(g_{2024-25}\) lineup-context function.
- 2025-26 pre-season player profiles, constructed from data through 2024-25.
- Realized 2025-26 lineups and possession exposure under the leaderboard's explicit oracle-allocation contract.
No 2025-26 regular-season or playoff result enters a 2025-26 prediction. The run fits and stores \(g_{2025-26}\) only after the frozen predictions are created, so that function is available for the 2026-27 state. A synthetic three-season regression test enforces this order: the 2025-26 evaluator must receive \(g_{2024-25}\), not \(g_{2025-26}\).
First Recursive Exemplar
artifacts/models/forward_contextual_rapm/2025-26/forward-contextual-rapm-2025-26-20260807T055233Z-b4da0c2c/
rolls the state from 1996-97 through 2025-26. For this controlled first pass,
each RAPM season uses the already-published forward-RAPM lambda schedule and
each contextual residual uses fixed Ridge alpha 10,000. Contextual alpha tuning
is intentionally deferred so this experiment isolates the state transition.
The frozen 2025-26 forecast uses only the completed 2024-25 contextual model, 2024-25 player state, and 2025-26 preseason profiles.
A dedicated regression test enforces this boundary: the evaluator must receive
g_2024-25; the subsequently fitted g_2025-26 may be stored for 2026-27 but
cannot score the 2025-26 holdout.
| Cohort | Possession RMSE | Possession MAE | Game-margin RMSE | Team NetRtg RMSE | Pythagorean win RMSE |
|---|---|---|---|---|---|
| 2025-26 regular season | 1.199008 | 1.141571 | 14.6525 | 4.1572 | 9.3153 |
| 2025-26 playoffs | 1.192898 | 1.135625 | 17.5493 | - | - |
The possession RMSE regression means this is not an unconditional replacement for every use case. The substantially better game, team NetRtg, and win-total results make it the project gold standard for its current oracle-lineup preseason contract. It still requires replication across additional frozen target seasons before claiming a general performance advantage.
Outputs
historical_player_coefficients.parquet and season_player_priors.parquet
record the recursive player state. season_context_models.joblib stores one
completed contextual model per season; season_context_metadata.parquet
records its fixed alpha and fit diagnostics. Frozen possession, game, team
NetRtg, and Pythagorean-win outputs use the standard leaderboard contract.
The separate forward_contextual_rankings artifact records the completed
additive player state used for the following season's public rankings.
2025-26 Lineup Context Case Study
These examples use the frozen g_2024-25 context function and 2025-26 preseason profiles. The context scores do not use 2025-26 point outcomes, but this retrospective case study does use the five-man units, opponent matchups, games, and possession exposure that actually occurred in 2025-26. It is therefore a frozen score conditional on realized lineup allocation, not a preseason forecast of which units would play.
Actual-matchup context is the possession-weighted correction in the unit's real 2025-26 opponents. Standardized context instead averages an orientation-symmetrized correction against the possession-weighted distribution of the 25 established units in this study, excluding the unit's own team:
All values are net-rating points per 100 possessions. Frozen additive is the preseason player-prior difference; frozen full adds frozen matchup context and the realized home/road mix. Observed NetRtg is descriptive and is not used to select or fit the frozen state.
Retrospective State Update
The same realized units can also be scored after 2025-26 concludes. Completed additive replaces the preseason player priors with the completed 2025-26 player coefficients. Completed full additionally replaces g_2024-25 with the completed g_2025-26 contextual function. Both completed columns are in-sample descriptive estimates: they use 2025-26 outcomes during fitting and must not be interpreted as a second forecast.
For a realized home/away stint \(s\), the two full estimates are:
The tables possession-weight these signed stint estimates over each unit's realized 2025-26 matchups. Thus the difference between the two full columns is the season's combined player-state and contextual-state revision.
The error summary is possession-weighted across the established units in these tables; it is a compact accounting of how the fitted season revised the frozen expectation, rather than an independent validation result.
| Estimate | Possession-weighted RMSE | Possession-weighted MAE |
|---|---|---|
| Frozen additive player state | 13.27 | 10.60 |
| Frozen full contextual state | 13.03 | 10.18 |
| Completed additive player state | 8.67 | 7.05 |
| Completed full contextual state | 7.78 | 6.21 |
Worked Context Decomposition
The highest-ranked unit is the LAC lineup of James Harden / Kawhi Leonard / Kris Dunn / Ivica Zubac / John Collins (614 possessions, 24 games). Its frozen standardized context effect is +2.60 points per 100 possessions.
For each original feature \(k\), the spline-Ridge pipeline produces five basis contributions. They are summed into \(q_k(L,O)\), then the displayed component is the possession-weighted orientation-symmetrized attribution:
Focal minus reference is the focal lineup's possession-weighted raw feature difference against the same realized 2025-26 reference units. Contribution is the model's nonlinear net-rating attribution, not a causal or individual-player credit. The total row exactly equals the unit's standardized context score.
| Context feature | Focal minus reference | Contribution (NetRtg / 100) |
|---|---|---|
| Steals | +2.03 | +2.01 |
| Top-two assists | +2.22 | +1.46 |
| Usage events | +3.31 | +0.30 |
| Three-point attempt volume | -4.51 | +0.25 |
| Rebounding-by-usage | +0.08 | +0.19 |
| Imputed-profile count | -0.09 | +0.18 |
| Offensive rebounds | +0.94 | +0.12 |
| Defensive rebounds | +6.05 | +0.07 |
| Diminishing offensive rebounding | +0.14 | +0.06 |
| Shooting-by-usage | -0.14 | +0.05 |
| Diminishing defensive rebounding | +0.48 | +0.05 |
| Usage concentration | +0.00 | +0.03 |
| Replacement-profile weight | -0.00 | -0.01 |
| Bottom-two three-point makes | -0.30 | -0.05 |
| Blocks | +0.23 | -0.06 |
| Credible-shooter count | +0.87 | -0.23 |
| Turnovers | +1.56 | -0.37 |
| Assists | +1.43 | -0.39 |
| Shooter-by-passing | +21.33 | -0.46 |
| Three-point makes | -1.44 | -0.62 |
| Total standardized context | - | +2.60 |
Response Curves For Diminishing-Return Candidates
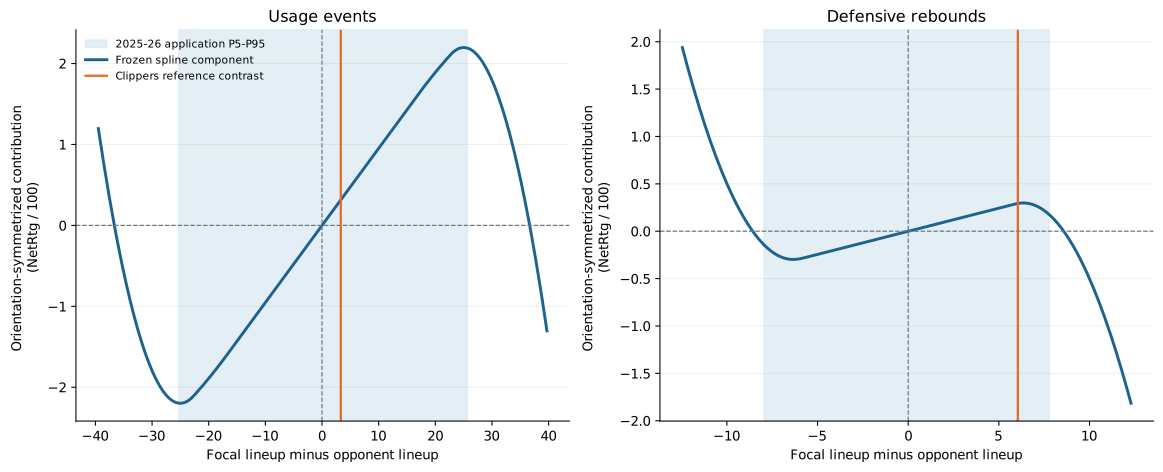
These curves isolate the frozen orientation-symmetrized spline component for relative usage events and relative defensive rebounds. Zero means equal focal and opponent feature values, and all other contextual features are held at zero. The blue band marks the 5th-to-95th percentile range observed when applying the model to 2025-26 stints; the orange line marks the Clippers unit's focal-minus-reference contrast. A flattening curve within the blue band is evidence that the fitted contextual residual is saturating for that feature.
For a single relative feature value \(z\), the plotted response is \(r_k(z)=[q_k(z)-q_k(-z)]/2\). This is the same orientation convention used by the standardized-context attribution, evaluated with every other contextual feature held at zero.
Interpretation
For usage events, the frozen component is approximately linear across the observed application band: it moves from -2.20 at the 5th-percentile difference (-25.29) to +2.19 at the 95th percentile (+25.65). The Clippers unit's relative usage contrast of +3.31 maps to an isolated response of +0.32. This frozen model does not show strong usage saturation in its observed application range.
Defensive rebounding is more nonlinear. Within the observed band, its largest positive component is +0.30 near a relative difference of +6.31, then it falls to +0.18 at the 95th-percentile difference (+7.77). The Clippers contrast is +6.05, with an isolated response of +0.29. That shape is consistent with diminishing marginal contextual value, but it is not a causal estimate of rebounding value.
The attribution table averages this response over each actual reference lineup, whereas the orange line evaluates it at the average raw feature contrast. With a nonlinear spline, \(\mathbb{E}[r_k(Z)]\) need not equal \(r_k(\mathbb{E}[Z])\), so those two displayed values need not match.
Table Definitions
Rank: rank by frozen standardized context, used only to select the positive and negative examples.Poss.andGames: realized 2025-26 shared exposure for the five-player unit; both are eligibility filters, not model inputs.Standardized context: frozeng_2024-25averaged over the established-unit opponent distribution of established lineups that actually appeared in 2025-26. It answers how favorable the unit's composition is against a shared realized reference schedule, not against a synthetic average lineup.Frozen matchup context: frozeng_2024-25averaged only over the opponents the unit actually faced in 2025-26. It is the context component ofFrozen full.Frozen additive: the signed sum of the five preseason player priors minus the five opposing preseason player priors, averaged over actual matchups.Frozen full: frozen additive value, frozen matchup context, and the unit's realized home/road mix. This is the frozen forecast for its realized allocation.Completed additive: the same additive calculation after replacing preseason priors with completed 2025-26 player coefficients.Completed matchup context: completedg_2025-26averaged over the unit's actual 2025-26 opponents.Completed full: completed additive value, completed matchup context, and the same realized home/road mix. It is an in-sample retrospective estimate.Observed NetRtg: the unit's possession-weighted realized net rating in those same matchups. It is an outcome, never an input to the frozen forecast.
Eligibility: at least 250 shared possessions and 20 games. The tables are sortable.
Immutable case-study artifact: artifacts/models/forward_contextual_case_study/2025-26/forward-contextual-case-study-2025-26-20260807T213817Z-df8ecb4f.
The tables are ranked only by Standardized context: the frozen, opponent-standardized contextual effect. Frozen matchup context, the full model estimates, and Observed NetRtg do not determine rank.
Largest Positive Frozen Context Effects
| Rank | Team | Players | Poss. | Games | Standardized context | Frozen matchup context | Frozen additive | Frozen full | Completed additive | Completed matchup context | Completed full | Observed NetRtg |
|---|---|---|---|---|---|---|---|---|---|---|---|---|
| 1 | LAC | James Harden / Kawhi Leonard / Kris Dunn / Ivica Zubac / John Collins | 614 | 24 | +2.60 | +1.56 | +12.23 | +13.29 | +3.70 | +3.15 | +6.36 | +5.05 |
| 2 | HOU | Kevin Durant / Alperen Sengun / Jabari Smith Jr. / Tari Eason / Amen Thompson | 615 | 36 | +1.79 | +2.61 | +2.89 | +5.68 | +1.47 | +3.38 | +5.03 | +8.78 |
| 3 | HOU | Kevin Durant / Josh Okogie / Alperen Sengun / Jabari Smith Jr. / Amen Thompson | 752 | 41 | +1.50 | +1.52 | +2.31 | +3.93 | +0.93 | +3.49 | +4.51 | +9.71 |
| 4 | LAL | LeBron James / Deandre Ayton / Luka Dončić / Rui Hachimura / Austin Reaves | 282 | 20 | +1.47 | +2.60 | +5.17 | +8.69 | +0.66 | +0.96 | +2.52 | -15.23 |
| 5 | MIN | Rudy Gobert / Julius Randle / Donte DiVincenzo / Anthony Edwards / Jaden McDaniels | 1,475 | 54 | +1.10 | +2.15 | +1.22 | +3.19 | +3.31 | +2.16 | +5.30 | +8.07 |
| 6 | DET | Tobias Harris / Duncan Robinson / Cade Cunningham / Jalen Duren / Ausar Thompson | 1,114 | 42 | +0.99 | +2.18 | +5.64 | +7.88 | +11.15 | +1.18 | +12.38 | +12.03 |
| 7 | PHX | Devin Booker / Royce O'Neale / Dillon Brooks / Mark Williams / Collin Gillespie | 560 | 30 | +0.73 | +1.93 | +3.39 | +5.00 | +2.52 | +0.62 | +2.83 | +10.36 |
| 8 | CHA | Miles Bridges / LaMelo Ball / Moussa Diabaté / Brandon Miller / Kon Knueppel | 1,028 | 49 | +0.26 | +0.47 | -3.08 | -2.75 | +9.57 | +3.22 | +12.66 | +26.93 |
| 9 | DEN | Aaron Gordon / Nikola Jokić / Jamal Murray / Cameron Johnson / Christian Braun | 732 | 23 | +0.14 | +0.81 | +8.88 | +10.15 | +14.14 | +1.24 | +15.82 | +14.48 |
| 10 | HOU | Kevin Durant / Alperen Sengun / Jabari Smith Jr. / Amen Thompson / Reed Sheppard | 559 | 44 | +0.12 | +2.04 | +3.52 | +5.46 | +1.90 | +3.20 | +5.00 | -4.65 |
Largest Negative Frozen Context Effects
| Rank | Team | Players | Poss. | Games | Standardized context | Frozen matchup context | Frozen additive | Frozen full | Completed additive | Completed matchup context | Completed full | Observed NetRtg |
|---|---|---|---|---|---|---|---|---|---|---|---|---|
| 25 | TOR | Brandon Ingram / RJ Barrett / Immanuel Quickley / Scottie Barnes / Collin Murray-Boyles | 333 | 20 | -4.20 | -3.69 | +0.02 | -2.88 | +1.80 | -1.59 | +0.97 | +4.81 |
| 24 | MIL | Myles Turner / Kyle Kuzma / Gary Trent Jr. / Ryan Rollins / AJ Green | 284 | 22 | -3.71 | -4.17 | -4.43 | -8.47 | -9.18 | -4.25 | -13.31 | -5.27 |
| 23 | BOS | Jaylen Brown / Derrick White / Neemias Queta / Payton Pritchard / Jordan Walsh | 377 | 26 | -1.47 | -0.25 | -0.99 | -1.34 | +8.14 | +2.00 | +10.04 | +4.24 |
| 22 | TOR | Brandon Ingram / Jakob Poeltl / RJ Barrett / Immanuel Quickley / Scottie Barnes | 736 | 28 | -1.35 | +0.25 | +3.60 | +3.66 | +2.64 | +1.51 | +3.97 | +9.51 |
| 21 | ORL | Wendell Carter Jr. / Desmond Bane / Jalen Suggs / Paolo Banchero / Anthony Black | 508 | 21 | -1.34 | +0.15 | +0.28 | +0.71 | +1.84 | +0.76 | +2.87 | +6.69 |
| 20 | ORL | Wendell Carter Jr. / Desmond Bane / Paolo Banchero / Anthony Black / Tristan da Silva | 351 | 26 | -1.17 | -0.39 | -1.17 | -1.82 | +0.30 | -0.93 | -0.88 | +10.55 |
| 19 | ATL | CJ McCollum / Nickeil Alexander-Walker / Onyeka Okongwu / Jalen Johnson / Dyson Daniels | 826 | 30 | -0.90 | +1.46 | +0.52 | +2.14 | +6.36 | +2.28 | +8.79 | +20.57 |
| 18 | ORL | Wendell Carter Jr. / Desmond Bane / Jalen Suggs / Paolo Banchero / Tristan da Silva | 542 | 24 | -0.88 | -0.82 | -0.53 | -0.97 | +2.15 | -0.76 | +1.76 | +10.69 |
| 17 | DET | Tobias Harris / Duncan Robinson / Jalen Duren / Ausar Thompson / Daniss Jenkins | 378 | 22 | -0.86 | +1.38 | +1.41 | +2.99 | +7.82 | +0.78 | +8.79 | +28.87 |
| 16 | BOS | Jaylen Brown / Derrick White / Neemias Queta / Payton Pritchard / Sam Hauser | 392 | 35 | -0.63 | +0.41 | +0.41 | +0.82 | +9.22 | +1.53 | +10.75 | +19.90 |
2026-27 Player Rankings
These are the top 100 player priors carried from the completed 2025-26 forward contextual RAPM state. They are predictions for the next regular season, not retrospective rankings.
The one-number value is the model's additive player component. The completed lineup-context function g_2025-26 remains a separate lineup-level term, so it is not assigned to individual players. The table covers players who appeared in 2025-26; it does not yet add the incoming rookie class or account for offseason roster moves.
The table is sortable by every column. Adjustment is the completed-season movement from the preseason prior that entered the fit; interpret limited exposure alongside possession count.
Immutable ranking artifact: artifacts/models/forward_contextual_rankings/2026-27/forward-contextual-rankings-2026-27-20260807T130321Z-442539da.
| Rank | Player | Pos. | 2026-27 contextual RAPM prior | 2025-26 preseason prior | Adjustment | 2025-26 possessions |
|---|---|---|---|---|---|---|
| 1 | Nikola Jokić | C | +9.43 | +8.16 | +1.26 | 4,786 |
| 2 | Victor Wembanyama | F-C | +6.42 | +1.24 | +5.18 | 3,896 |
| 3 | Shai Gilgeous-Alexander | G | +6.41 | +5.74 | +0.66 | 4,730 |
| 4 | Kawhi Leonard | F | +6.30 | +3.18 | +3.12 | 4,167 |
| 5 | Jimmy Butler III | F | +6.29 | +5.33 | +0.96 | 2,449 |
| 6 | Derrick White | G | +6.07 | +2.32 | +3.75 | 5,180 |
| 7 | Giannis Antetokounmpo | F | +6.05 | +5.03 | +1.02 | 2,129 |
| 8 | Joel Embiid | C-F | +5.53 | +4.52 | +1.00 | 2,479 |
| 9 | Bam Adebayo | C-F | +5.17 | +2.02 | +3.15 | 5,031 |
| 10 | Jrue Holiday | G | +4.88 | +3.84 | +1.04 | 3,295 |
| 11 | Chet Holmgren | C-F | +4.66 | +2.00 | +2.65 | 4,129 |
| 12 | Devin Booker | G | +4.61 | +2.87 | +1.74 | 4,442 |
| 13 | Jayson Tatum | F-G | +4.35 | +4.36 | -0.01 | 1,046 |
| 14 | Lauri Markkanen | F-C | +4.22 | +1.96 | +2.26 | 3,080 |
| 15 | Stephen Curry | G | +4.14 | +6.02 | -1.87 | 2,822 |
| 16 | Aaron Gordon | F | +3.99 | +2.42 | +1.57 | 2,057 |
| 17 | Marcus Smart | G | +3.94 | +1.80 | +2.14 | 3,607 |
| 18 | Donovan Mitchell | G | +3.73 | +2.95 | +0.78 | 4,925 |
| 19 | Jarrett Allen | C | +3.71 | +3.93 | -0.22 | 3,191 |
| 20 | Chris Paul | G | +3.70 | +6.03 | -2.33 | 457 |
| 21 | Cade Cunningham | G | +3.67 | +2.00 | +1.67 | 4,490 |
| 22 | Alex Caruso | G | +3.67 | +3.86 | -0.19 | 2,125 |
| 23 | Franz Wagner | F | +3.66 | +4.37 | -0.71 | 2,190 |
| 24 | Karl-Anthony Towns | C-F | +3.53 | +3.54 | -0.00 | 4,716 |
| 25 | Kon Knueppel | G-F | +3.50 | -0.13 | +3.63 | 5,207 |
| 26 | Davion Mitchell | G | +3.37 | +1.10 | +2.27 | 4,265 |
| 27 | Pascal Siakam | F | +3.29 | +2.96 | +0.33 | 4,322 |
| 28 | OG Anunoby | F-G | +3.27 | +2.35 | +0.92 | 4,531 |
| 29 | Rudy Gobert | C | +3.23 | +3.51 | -0.28 | 4,951 |
| 30 | CJ McCollum | G | +3.17 | +0.41 | +2.76 | 4,762 |
| 31 | Brandon Miller | F | +3.15 | -0.41 | +3.57 | 3,968 |
| 32 | Kevin Huerter | G-F | +3.11 | +1.53 | +1.57 | 3,244 |
| 33 | Zach Edey | C | +3.07 | +0.75 | +2.32 | 588 |
| 34 | Michael Porter Jr. | F | +2.98 | +0.34 | +2.64 | 3,396 |
| 35 | Jalen Smith | F-C | +2.93 | -0.16 | +3.09 | 2,316 |
| 36 | Cedric Coward | G | +2.92 | -0.50 | +3.43 | 3,386 |
| 37 | Tobias Harris | F | +2.91 | +2.74 | +0.18 | 3,604 |
| 38 | Kevin Durant | F | +2.90 | +2.78 | +0.12 | 5,732 |
| 39 | Steven Adams | C | +2.85 | +0.89 | +1.97 | 1,455 |
| 40 | Paul George | F | +2.79 | +3.90 | -1.11 | 2,328 |
| 41 | Luka Dončić | F-G | +2.78 | +2.67 | +0.12 | 4,759 |
| 42 | Collin Gillespie | G | +2.74 | -0.14 | +2.89 | 4,626 |
| 43 | Isaiah Hartenstein | C-F | +2.58 | +1.35 | +1.22 | 2,340 |
| 44 | Dyson Daniels | G | +2.56 | -0.12 | +2.68 | 5,317 |
| 45 | Julius Randle | F-C | +2.49 | +1.67 | +0.82 | 5,470 |
| 46 | Al Horford | C-F | +2.46 | +4.44 | -1.99 | 1,986 |
| 47 | Kyle Lowry | G | +2.44 | +3.86 | -1.42 | 251 |
| 48 | Nickeil Alexander-Walker | G | +2.41 | +0.45 | +1.95 | 5,561 |
| 49 | Jalen Brunson | G | +2.39 | +2.66 | -0.28 | 5,240 |
| 50 | Wendell Carter Jr. | C-F | +2.36 | +1.58 | +0.78 | 4,768 |
| 51 | Herbert Jones | F | +2.31 | +1.95 | +0.36 | 3,289 |
| 52 | Svi Mykhailiuk | G-F | +2.30 | +0.35 | +1.95 | 2,453 |
| 53 | Amen Thompson | G-F | +2.25 | +0.47 | +1.78 | 5,936 |
| 54 | LaMelo Ball | G | +2.25 | -0.72 | +2.96 | 4,101 |
| 55 | Aaron Holiday | G | +2.17 | +1.47 | +0.70 | 1,579 |
| 56 | Dylan Harper | G | +2.17 | +0.05 | +2.11 | 3,207 |
| 57 | Jalen Duren | C | +2.16 | +0.21 | +1.95 | 4,080 |
| 58 | Devin Vassell | G-F | +2.11 | -2.38 | +4.49 | 4,258 |
| 59 | Ausar Thompson | G-F | +2.08 | +0.74 | +1.35 | 3,897 |
| 60 | Julian Champagnie | F | +2.01 | -2.17 | +4.18 | 4,745 |
| 61 | Joe Ingles | F-G | +1.95 | +2.91 | -0.95 | 338 |
| 62 | VJ Edgecombe | G | +1.94 | -0.01 | +1.95 | 5,402 |
| 63 | De'Anthony Melton | G | +1.89 | +0.39 | +1.50 | 2,311 |
| 64 | James Harden | G | +1.85 | +5.62 | -3.77 | 4,936 |
| 65 | Obi Toppin | F | +1.84 | +0.78 | +1.06 | 901 |
| 66 | Evan Mobley | C | +1.82 | +1.98 | -0.16 | 4,315 |
| 67 | Miles McBride | G | +1.79 | -0.24 | +2.03 | 2,172 |
| 68 | Neemias Queta | C | +1.77 | -2.47 | +4.24 | 3,752 |
| 69 | Isaiah Joe | G | +1.77 | +1.57 | +0.19 | 3,108 |
| 70 | Cameron Johnson | F | +1.76 | +1.07 | +0.69 | 3,421 |
| 71 | LeBron James | F | +1.74 | +3.98 | -2.24 | 4,077 |
| 72 | Payton Pritchard | G | +1.74 | +0.32 | +1.42 | 5,014 |
| 73 | Grant Williams | F | +1.73 | -0.85 | +2.59 | 1,438 |
| 74 | Aaron Nesmith | G-F | +1.70 | +1.82 | -0.12 | 2,809 |
| 75 | Desmond Bane | G | +1.68 | +0.10 | +1.58 | 5,768 |
| 76 | Hugo González | G | +1.66 | -1.92 | +3.58 | 2,133 |
| 77 | Coby White | G | +1.63 | +0.72 | +0.91 | 2,587 |
| 78 | Josh Green | G | +1.60 | -1.93 | +3.53 | 1,804 |
| 79 | Jalen Suggs | G | +1.58 | +0.42 | +1.16 | 3,370 |
| 80 | Nique Clifford | G | +1.57 | -1.22 | +2.79 | 3,873 |
| 81 | Dwight Powell | F-C | +1.57 | +0.33 | +1.24 | 1,906 |
| 82 | Duncan Robinson | F | +1.56 | -0.60 | +2.16 | 4,362 |
| 83 | Jaren Jackson Jr. | F-C | +1.52 | +2.12 | -0.61 | 3,071 |
| 84 | Tim Hardaway Jr. | G-F | +1.52 | +1.65 | -0.13 | 4,401 |
| 85 | Immanuel Quickley | G | +1.51 | +1.96 | -0.44 | 4,561 |
| 86 | Ethan Thompson | G | +1.49 | +0.00 | +1.49 | 1,359 |
| 87 | Cooper Flagg | F | +1.48 | +0.00 | +1.47 | 4,943 |
| 88 | Stephon Castle | G | +1.47 | -1.09 | +2.56 | 4,266 |
| 89 | Jakob Poeltl | C | +1.46 | +2.42 | -0.97 | 2,355 |
| 90 | De'Aaron Fox | G | +1.44 | -0.71 | +2.15 | 4,707 |
| 91 | Moussa Diabaté | F | +1.40 | -2.42 | +3.82 | 3,790 |
| 92 | Anthony Davis | F-C | +1.39 | +2.00 | -0.61 | 1,296 |
| 93 | RJ Barrett | F-G | +1.35 | -1.06 | +2.41 | 3,561 |
| 94 | Kevin Love | F-C | +1.30 | +1.44 | -0.14 | 1,306 |
| 95 | Monte Morris | G | +1.26 | +1.72 | -0.46 | 138 |
| 96 | Harrison Barnes | F | +1.26 | +1.08 | +0.18 | 4,124 |
| 97 | Ja Morant | G | +1.25 | +2.53 | -1.28 | 1,238 |
| 98 | Dorian Finney-Smith | F | +1.23 | +3.00 | -1.78 | 1,249 |
| 99 | Scottie Barnes | F-G | +1.22 | -0.69 | +1.91 | 5,512 |
| 100 | Seth Curry | G | +1.19 | +1.05 | +0.14 | 268 |