Split NAIL-RAPM
Split NAIL is the planned offense/defense extension of NAIL-RAPM. It estimates points-created and points-prevented player ratings while retaining NAIL's separation of additive player profiles from non-additive lineup effects.
Possession-side target
For offensive unit \(U\) against defensive unit \(V\), the model predicts:
Higher \(D_i\) means more points prevented. A player's combined rating remains \(O_i+D_i\). Stints produce two observations: home offense against away defense and away offense against home defense.
Unconstrained feature contract
No profile feature is preassigned to offense or defense. For the same strictly lagged player profile \(x_i\):
All eight current additive profile features, plus the retained non-additive
lineup features top_two_assists and usage_concentration, receive separate
offense and defense coefficients. Ridge regularization, rather than semantic
zero constraints, determines whether a feature has useful signal on either
side. This permits effects such as free-throw generation indirectly predicting
defensive performance through game-state or transition mechanisms.
Before fitting, each profile or lineup feature is divided by its possession-weighted standard deviation in the completed season. That puts its Ridge penalty on the same one-standard-deviation scale as the other feature blocks. Player coefficients remain in their native per-100-possession units; artifacts record both standardized and raw profile coefficients.
The B2B flag is a distinct schedule control, known before tipoff from the game calendar. It has an offense coefficient \(b^O\) and a defense coefficient \(b^D\), rather than being forced into a single signed game-level term. Thus, when the home team is on a back-to-back, the home-offense row gets \(+b^O\), while the away-offense row gets \(-b^D\). The same two parameters are estimated with the feature block and are carried only from a completed season into its next-season forecast. Home court uses the same side-specific logic: \(h^O\) is a home scoring advantage and \(h^D\) is a home defensive advantage that suppresses the away scoring row. Neither is forced to be zero or to equal the other.
Standalone Forward Prior Bridge
Split NAIL derives its combined prior \(P_{i,t}\) within its own forward history. It uses the same accepted scalar-prior ingredients as production NAIL: lagged player value, value-conditioned aging, exposure-gated cold starts, replacement tokens, and gap-returner handling. It does not import a fitted production NAIL player vector or context artifact.
The neutral initial side split is \(P_{i,t}/2\) on each side. The model carries the previous Split NAIL specialization \(d_{i,t-1}=O_{i,t-1}-D_{i,t-1}\):
Therefore \(\mu_{i,t}^{O}+\mu_{i,t}^{D}=P_{i,t}\) exactly. New players have \(d_{i,t-1}=0\), so they receive the neutral side split while retaining the forward aging and exposure-gated cold-start total prior.
Constrained O/D Coordinates
Every offense/defense coefficient pair, including player, additive-profile, non-additive lineup, B2B, and home-court terms, is fit in total and specialization coordinates:
Ridge precision on \(s\) is four times the corresponding precision on \(m\). This prevents an unconstrained O/D refit from cheaply changing a player’s total rating through two separately penalized side coefficients. Raw O/D coefficients are reconstructed only after the constrained fit.
Recursive fitting protocol
For completed season \(t\), Split NAIL fits both scoring directions for every stint: home offense against away defense, and away offense against home defense. The player-state penalty is centered on the scalar NAIL prior and the preceding Split NAIL side difference. Profile and lineup columns are divided by their season-specific possession-weighted standard deviations; their Ridge precision is fixed relative to the player-state precision.
The next season uses only completed source-season information:
- The completed standalone Split history supplies \(P_{i,t+1}\), including its aging and cold-start logic.
- Split NAIL carries \(d_{i,t}=O_{i,t}-D_{i,t}\).
- Prior-season player profiles construct target-season lineup features.
- The completed season \(t\) profile coefficients score those features for a frozen evaluation of \(t+1\).
The first historical season has no earlier profile data, so its profile block is set explicitly to zero rather than imputed from the future.
Frozen evaluation
For each held-out season, the scorer uses the prior season's O/D feature and schedule coefficients with its separate home-offense and home-defense terms, then combines them with the scalar NAIL total prior and carried O/D specialization. It predicts both teams' points per 100 possessions on the exact shared frozen possession support used by the three-season leaderboard. Game margins use the same observed offensive possession allocation and game-reconstruction rules as every other candidate.
Attribution Audit
The no-refit attribution audit, persisted under
artifacts/audits/split_nail_attribution/, replays the persisted Split state
on the exact frozen possession support and verifies
that its term-by-term reconstruction equals the published replay prediction to
floating-point precision. It is an explanatory audit, not a new candidate or a
hybrid refit.
For a home offensive possession, the source-season Split state is evaluated as:
where \(P\) is the O/D player state, \(A\) is the additive profile block, \(N\) is the retained non-additive block, \(h\) is home court, and \(b\) is the back-to-back effect. The away-offense equation reverses the units and uses the defense-side home and rest coefficients. The audit converts each row into home-net-rating units before summarizing it, so all terms use the same sign convention.
Every frozen target season uses only the preceding completed Split state. Thus, for example, 2025-26 uses 2024-25 O/D player specialization, profile coefficients, home-court terms, and B2B terms. The completed 2025-26 coefficients shown below are descriptive diagnostics only; they are not used to predict 2025-26.
Frozen agreement with production NAIL
The Split forecast is related but not a numerical reformat of production NAIL. Its scalar player prior has roughly \(0.95\) correlation with production on each target-season player pool, while its possession predictions have \(0.77\) to \(0.84\) correlation. The gap arises after the scalar prior: from the recursively carried O/D specialization and side-specific profile, lineup, and schedule terms.
| Target | Cohort | Possessions | Prediction correlation | Split minus NAIL RMSE |
|---|---|---|---|---|
| 2023-24 | Regular season | 182,729 | 0.835 | 0.0501 |
| 2023-24 | Playoffs | 12,570 | 0.828 | 0.0566 |
| 2024-25 | Regular season | 183,431 | 0.843 | 0.0448 |
| 2024-25 | Playoffs | 13,144 | 0.813 | 0.0515 |
| 2025-26 | Regular season | 218,810 | 0.825 | 0.0377 |
| 2025-26 | Playoffs | 14,253 | 0.771 | 0.0510 |
| Target | Shared players | Scalar-prior correlation | Prior-difference RMSE |
|---|---|---|---|
| 2023-24 | 567 | 0.948 | 0.699 |
| 2024-25 | 565 | 0.945 | 0.705 |
| 2025-26 | 578 | 0.948 | 0.681 |
Component scale
These are not variance shares: player, profile, and lineup terms co-vary. They show the average absolute size of each scored home-net-rating term across the three frozen regular seasons. The large profile values reflect the O/D scoring construction, in which a unit's offensive profile and its opponent's defensive profile both enter a possession row. They should not be interpreted as a separate amount of player credit.
| Component | Mean absolute net-rating points | Standard deviation |
|---|---|---|
| O/D player state | 2.91 | 3.65 |
| Additive profile | 7.32 | 8.38 |
| All retained non-additive terms | 5.27 | 5.52 |
top_two_assists |
2.12 | 2.54 |
usage_concentration |
3.16 | 3.40 |
| Home court | 0.89 | 0.14 |
| Back-to-back | 0.17 | 0.35 |
Four non-additive coefficient series
There are exactly two retained non-additive features, but Split NAIL estimates
each on both scoring sides: top_two_assists on offense and defense, plus
usage_concentration on offense and defense. The chart puts all four on a
common scale: expected net-rating change from a one completed-season lineup
standard-deviation increase in the feature. Blue is offense and orange is
defense. A positive defense-side coefficient means the defensive unit is
expected to suppress more opponent scoring.
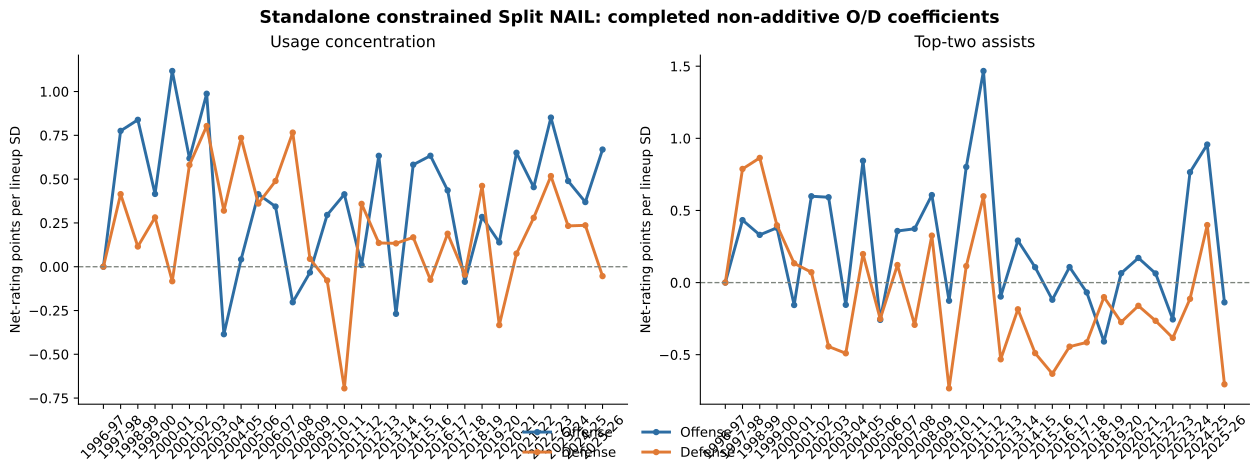
For the actual frozen 2025-26 forecast, the source is 2024-25. Its one-SD effects were: top-two assists \(+0.96\) offense and \(+0.40\) defense; usage concentration \(+0.37\) offense and \(+0.24\) defense. The full series is visibly less stable than the scalar player state, which is one reason Split NAIL remains a transparent non-promoted companion rather than the production rating.
Status
The constrained B2B-aware 1996-97 through 2025-26 recursive refit is evaluated through the shared-support harness. Its leaderboard row remains visible whether or not it meets the promotion gate. The artifact contains per-season O/D player ratings, combined priors, standardized and raw side-feature coefficients, side-specific B2B coefficients, and the immutable shared-support evaluation audit.
Three-Season Result
The no-refit replay asserted identical possession identifiers and realized outcomes against the production frozen artifact for every target season, including all 39,967 playoff possessions. Regular support is 182,729 possessions / 1,026 games in 2023-24; 183,431 / 1,028 in 2024-25; and 218,810 / 1,230 in 2025-26. Full-game regular outcomes also match across all 3,511 reconstructed games.
| Pooled eligible-cohort metric | B2B Split NAIL | Production NAIL-RAPM v1.2.1.2 |
|---|---|---|
| Possession RMSE | 1.198026 | 1.197946 |
| Possession MAE | 1.142568 | 1.141313 |
| Possession skill | 0.1144% | 0.1279% |
| Eligible game-margin RMSE | 13.9679 | 14.0107 |
| Eligible game skill | 18.8598% | 18.3623% |
| Full-game margin RMSE | 14.2668 | 14.2330 |
| Game-winner accuracy | 66.56% | 67.96% |
| Team NetRtg RMSE | 3.3020 | 3.2847 |
| Pythagorean-win RMSE | 6.9130 | 7.0551 |
| Pooled playoff metric | Constrained Split NAIL | Production NAIL-RAPM v1.2.1.2 |
|---|---|---|
| Possession RMSE | 1.194415 | 1.192710 |
| Possession MAE | 1.140791 | 1.137604 |
| Possession skill | -0.2214% | 0.0645% |
| Eligible game-margin RMSE | 16.5301 | 16.6032 |
| Eligible game skill | 8.4506% | 7.6393% |
The decomposition improves eligible-possession game-margin accuracy in both cohorts, but it loses on the primary possession metrics, full-game accuracy, and winner accuracy. It therefore does not clear promotion and is retained in the Three-Season Frozen Leaderboard as a comparable non-promoted candidate.
Player O/D Specialization Sensitivity
The player-side split is parameterized as \(M_i=O_i+D_i\) and \(S_i=O_i-D_i\). The player specialization multiplier \(r\) sets the relative Ridge precision on \(S\): \(\lambda_S=r\lambda_M\). Profile, B2B, and home-court specialization penalties remained fixed at their existing four-times setting. Each candidate reselected the player lambda independently within every source season, then replayed the identical three frozen regular and playoff seasons.
| Player \(r\) | Regular RMSE | Regular MAE | Eligible-game RMSE | Full-game RMSE | Winner accuracy | Playoff RMSE |
|---|---|---|---|---|---|---|
| 1 | 1.197990 | 1.142334 | 13.975749 | 14.273091 | 67.02% | 1.194424 |
| 2 | 1.198011 | 1.142476 | 13.974785 | 14.274299 | 67.05% | 1.194433 |
| 4 (control) | 1.198026 | 1.142568 | 13.967918 | 14.266819 | 66.56% | 1.194415 |
| 8 | 1.198056 | 1.142666 | 13.968324 | 14.267025 | 66.56% | 1.194393 |
The public DARKO export suggested a rough prior center near \(r\approx2.5\), but its rounded DPM fields are not a selection dataset. This was therefore an exploratory frozen sensitivity analysis, not a promotion study: no multiplier was selected on a pre-frozen development window. Retain \(r=4\) until a pre-registered development selection and untouched frozen confirmation agree.